Directivity plot
WinAudioMLS can control a turntable for automatic directivity measurements of
loudspeakers, microphones or other noise sources. You can plot the signal level
at different frequencies vs. the angle.
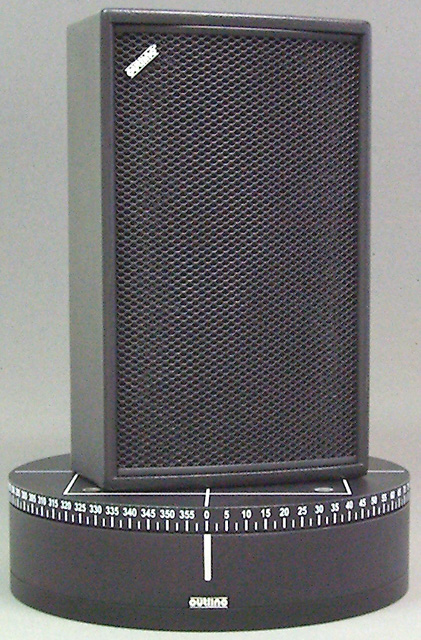
Currently the widely spread ET-2/ST-2 from Outline is supported.
It is connected to the parallel port of the PC. This unit has a resolution of
2.5° per step. Due to its solid structure it can load up to 100Kg.
Basically you define a start and stop angle and a step size. The step size must be a multiple of 2.5°.
The measurement can be clockwise or counterclockwise.
WinAudioMLS sets the turntable to the desired angle, waits the specified
settling time, performs a measurement, stores the result an continues with the
next angle.
You can shift the measurements with a constant offset. This means for example, that a measurement is performed physically from 0 to 90degree, but plotted from -45° to 45°.
During a sweep measurement, all channels (up to 64) are stored simultaneously.
After finishing the measurement, the results are drawn for 1000Hz. The following example is a dual source radiator, that shows the typical diffraction pattern.
You can freely select the analysis frequency.You can also plot overlays to draw curves from different distances or at different frequencies. You can freely define the plot area. In the following example we draw from -90° to 90°, only with two plots at 1000Hz and 4000Hz.
Requirements:
| Turntable Outline ET-2/ST-2 | |
| Parallel port (USB emulators are not supported) | |
| Windows 2000/XP/Vista |